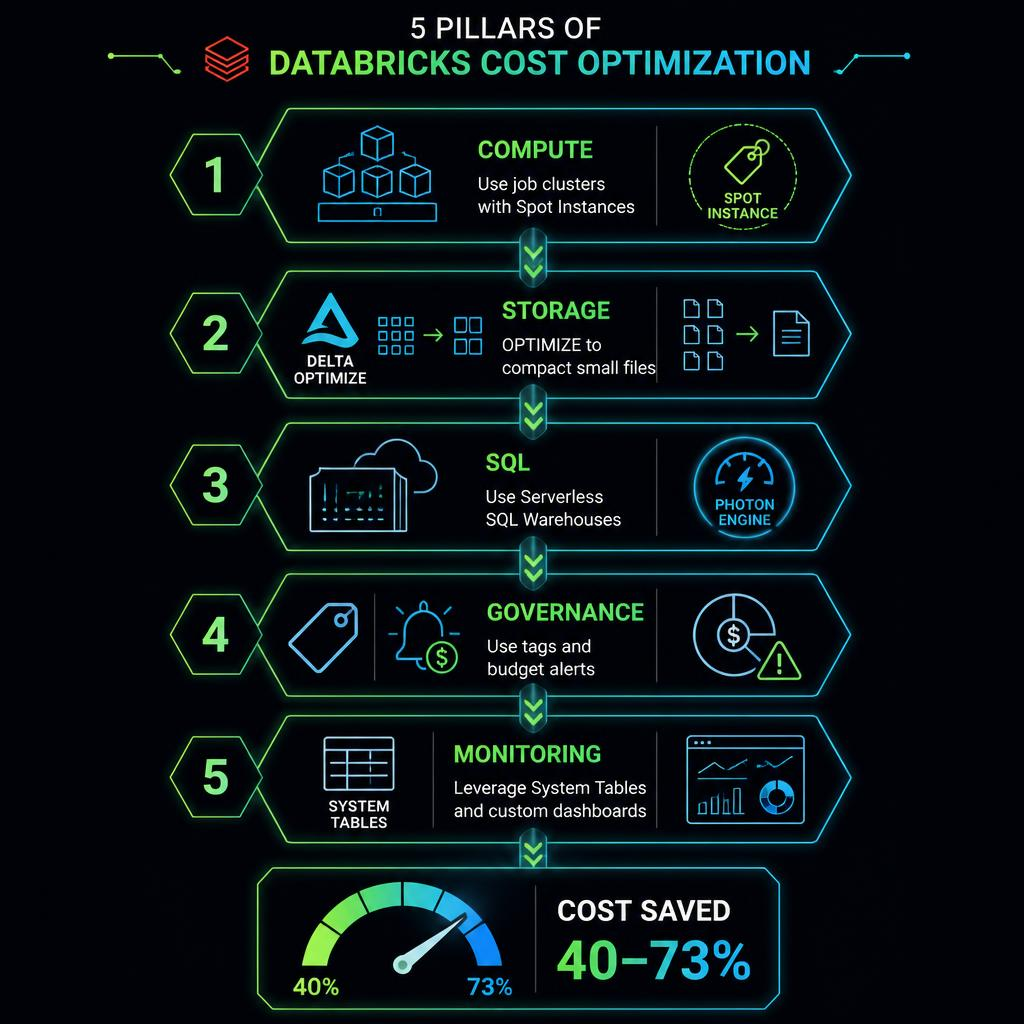
## The Databricks Cost Problem If you're running Databricks at any scale, you've felt the pain. **The average Databricks customer spends over $300K per year** — and a significant portion of that is wasted on misconfigured clusters, idle compute, and inefficient jobs. The good news? Most of that waste is preventable. With the right architecture, configuration, and monitoring, **you can reduce your Databricks bill by 40-73\%** without sacrificing performance. This guide walks through every lever you have — from compute and storage to governance and monitoring — with specific, actionable steps you can implement today. --- ## The Five Pillars of Databricks Cost Optimization

### Pillar 1: Compute Optimization **Compute is where the money goes.** DBUs are the unit of compute in Databricks, and most overspend comes from running clusters that are too large, too long, or on the wrong pricing tier. #### 1.1 Job Clusters vs All-Purpose Clusters This is the single biggest quick win. **All-purpose (interactive) clusters cost 73\% more per DBU** than job clusters in some regions. | Cluster Type | DBU Multiplier (Premium) | Use Case | |---|---|---| | All-Purpose | 1.5x (Interactive Analytics) | Ad-hoc analysis, notebooks, dashboards | | Job Clusters | 1.0x (Automated) | Production jobs, scheduled pipelines | | SQL Warehouse (Classic) | 1.0x | BI reporting, SQL analytics | | SQL Warehouse (Serverless) | 1.5x | High-concurrency, auto-scaling SQL | **Action:** Migrate all production ETL, batch processing, and scheduled jobs to job clusters. Keep all-purpose clusters only for dev/exploration. Save: **40-73\% on compute that's already scheduled**. #### 1.2 Autoscaling Best Practices Databricks autoscales workers based on load, but default settings often over-provision: - **Set min workers = 1** (not 0 or >1). This avoids cold-start delays and wasteful idle nodes. - **Set max workers = actual peak need + 20\% buffer** (not unlimited). Prevents runaway scaling. - **Enable Optimized Autoscaling** (Databricks Runtime 7.0+) — faster, more efficient scaling. - **Monitor cluster utilization** via Ganglia UI or System Tables. If average utilization < 60\%, reduce cluster size. #### 1.3 Spot (Preemptible) Instances Spot instances reduce cloud infrastructure costs by **60-90\%** compared to on-demand. - **Use spot for:** Batch jobs, dev/test, non-critical ETL, experimentation - **Use on-demand for:** Production SLA-bound workloads, streaming, interactive development - **Recommended mix:** 70\% spot + 30\% on-demand as fallback #### 1.4 Auto-Termination Every idle cluster burns money. - **Interactive clusters:** Set auto-termination to 30-60 minutes - **Job clusters:** Auto-terminate on job completion (no config needed) - **SQL Warehouses:** Enable auto-stop with 15-30 minute timeout --- ### Pillar 2: Storage & Delta Lake Optimization #### 2.1 Liquid Clustering vs Partitioning **Liquid clustering** (Databricks Runtime 11.3+) eliminates the need to choose the right partition columns upfront. It automatically optimizes data layout as data changes. **Action:** Migrate from Hive-style partitioning to liquid clustering for all new and existing Delta tables. #### 2.2 OPTIMIZE & Z-ORDER The **small file problem** is one of the most common sources of wasted compute. ```sql -- Compact small files and optimize layout OPTIMIZE your_table ZORDER BY (frequently_filtered_column); ``` **Cost impact:** Proper optimize reduces query times by 30-70\%, directly reducing DBU consumption. #### 2.3 VACUUM & File Retention ```sql -- Remove files older than 7 days VACUUM your_table RETAIN 168 HOURS; ``` **Best practice:** Set retention to 7-14 days (default is 30 days). Schedule VACUUM weekly. --- ### Pillar 3: SQL Warehouses & BI #### 3.1 Serverless vs Classic vs Pro - **Serverless:** Variable workloads, auto-scaling. Higher per-DBU but lower total cost due to pay-per-use. - **Classic:** Fixed-cost per cluster. Better for steady-state workloads. - **Pro:** 2x DBU multiplier — only use for critical business reporting. Serverless is typically **30-50\% cheaper in practice** despite the 1.5x DBU multiplier. #### 3.2 Auto-Stop Configuration **Set auto-stop to 15 minutes** for dev SQL Warehouses. For production BI, 30 minutes. #### 3.3 Query History Analysis Use `system.query.history` to identify expensive queries: ```sql SELECT query_text, ROUND(duration_ms / 1000, 1) AS duration_sec, ROUND(bytes_read_gb, 1) AS bytes_read_gb FROM system.query.history ORDER BY duration_ms DESC LIMIT 10; ``` --- ### Pillar 4: Governance & Cost Allocation You can't optimize what you can't measure. #### 4.1 Tagging Strategy Mandatory tags: **Environment**, **Team**, **Cost Center**, **Owner**. Tags flow through to AWS Cost Explorer / Azure Cost Management. #### 4.2 Budget Alerts - **Workspace budget:** 80\% → email alert - **Cluster budget:** 90\% → auto-terminate non-critical clusters - **Tag-based budget:** Per project/team threshold #### 4.3 System Tables for Cost Monitoring ```sql SELECT DATE(start_time) as day, cluster_type, ROUND(SUM(dbu_amount), 2) as total_dbu FROM system.billing.usage WHERE DATE(start_time) >= DATE_ADD(CURRENT_DATE, -30) GROUP BY 1, 2 ORDER BY 1 DESC, 3 DESC; ``` --- ### Pillar 5: Workflows & Orchestration #### 5.1 Cluster Reuse Group sequential tasks into the same workflow job to share clusters and avoid cold-start overhead. #### 5.2 Parallel Task Execution Run independent tasks in parallel within a single workflow to reduce total run time. #### 5.3 Photon Validation **Photon** accelerates SQL/DataFrame operations 2-10x. It costs more per DBU but typically saves **50-70\% net**. **When to enable Photon:** Heavy SQL workloads, Delta Lake reads, aggregation-heavy queries. **When to skip:** Python UDFs, ML training, streaming. --- ## The DataRazi Cost Audit Approach 1. **Discovery** (Week 1): Map current architecture, cluster configs, job schedules, billing data 2. **Analysis** (Week 2): Identify waste — idle clusters, oversized configs, inefficient queries 3. **Remediation** (Week 3-4): Implement changes — job clusters, spot instances, storage optimization 4. **Monitoring** (Ongoing): Dashboards, alerts, monthly cost reviews --- ## Quick Wins (Do These First) 1. **Enable job clusters** for all production workloads — biggest single impact 2. **Set auto-termination** on every interactive cluster (< 60 min) 3. **Enable spot instances** on non-critical clusters 4. **Configure budget alerts** at the workspace level 5. **Run OPTIMIZE** on your largest Delta tables 6. **Audit SQL Warehouse configs** — enable auto-stop, consider Serverless --- ## Cost Reduction Potential Summary | Area | Typical Savings | Effort | |---|---|---| | Job Clusters | 40-73\% | Low | | Spot Instances | 60-90\% (infra) | Low | | Cluster Autoscaling | 20-40\% | Low | | Auto-Termination | 15-30\% | Minimal | | Photon Enablement | 50-70\% (net) | Medium | | Liquid Clustering | 30-50\% (query) | Medium | | Budget Alerts + Governance | 10-20\% | Medium | | End-to-End Optimization | 40-73\% | 4-6 weeks | --- ## Next Steps Ready to cut your Databricks bill? **Start with the Quick Wins above — they cost nothing and take minutes to implement.** For deeper optimization, [contact DataRazi](https://datarazi.cloud/contact/) for a comprehensive cost audit and remediation plan. *Follow us on X/Twitter for weekly Databricks cost optimization tips and deep dives.*